


Estimation of Surface Tension of Pure Paraffin (Alkane) Hydrocarbons
Estimation of Surface Tension of Pure Paraffin (Alkane) Hydrocarbons
Mahmood Moshfeghian, Ph.D.
According to the GPSA Engineering Data Book [1], the interior molecules of a liquid exert an inward force of attraction upon the surface molecules that tends to minimize the surface area of the liquid. The work required to enlarge the surface area by one square centimeter is the surface free energy. The perpendicular force in the liquid surface, called surface tension, exerts a force parallel to the plane of the surface, and is linear in its extent.
Why should we care about surface tension?
Surface tension ( - dyne/cm) is an important property and is of interest for oil and gas production and processing facilities. Surface tension in most fluid dynamics impacts wetting, foaming, emulsion stability, and droplet formation. Understanding the impact of is important in the design of coalescing filters, separators, fractionators, absorbers, two-phase pipelines, and in reservoir calculations.
How to estimate ?
The details of estimation methods for surface tensions of both pure liquids and liquid mixtures are presented in chapter 12 of The Properties of Gases and Liquids [2]. Equation 1 presents the basic relationship for as a function of Parachor number, P, and the liquid,  , and vapor,
  , densities:
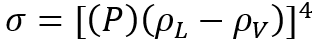 (1)
(1)
The temperature independent Parachor may be estimated from the structure of the molecules [2].
Instead of correlating surface tensions with densities, several correlations have been developed that relate to temperature, T [2].
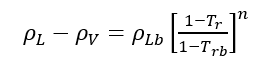 (2)
(2)
 is the molal liquid density at the normal boiling point in moles/(cm)3. Tr is the reduced temperature, T/Tc, and Trb is the reduced temperature at the normal boiling temperature, Trb/Tc.
For mixtures, reference [2] also presented the extensions of the pure component methods, as is a method based upon a thermodynamic analysis of the system.
Romero-Martinez and Trejo [3] presented a new correlation scheme for the surface tension of homologous series of pure liquid hydrocarbons, as a function of molecular weight and temperature. Using orthobaric surface tension data from literature for four homologous series of hydrocarbons, i.e., Paraffins, Olefins, Naphthenes, and Aromatics, they obtained individually adjustable parameters for two new surface tension equations.
The GPSA Engineering Data Book [1] presented Figure 23-38 (provided on the last page) for estimation of the surface tension for pure methane, C1, through n-octane, nC8, and the heavy ends with molecular weights of 140 to 240.
In this tip of the month (TOTM) the following two equations by Romero-Martinez and Trejo [3] are used to estimate the pure liquids surface tensions, as a function of temperature and molecular weight for the selected liquids shown in Figure 23-38 of the GPSA Engineering Data Book [1]. Equation 3 is for a specific compound.
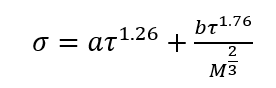 (3)
(3)
Equation 4 is the generalized form for a family of hydrocarbons.
 (4)
(4)
Where:
= Surface tension, dyne/cm
T = Temperature, °R (K)
Tc = Critical temperature, °R (K)
M = Molecular Weight
a and b = Fitted parameters in Eq. 3
A, B, C, and D = Fitted parameters in Eq. 4
N = Number of data points
 (5)
(5)
 (6)
(6)
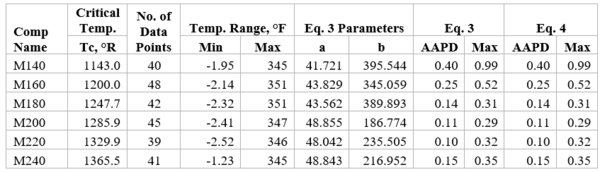
Figures 1 through 3 present the variation of surface tension with temperature for C1 through nC4, and nC5 through nC8, and the heavy ends for molecular weight of M140 through M240 smoothed data in Figure 23-38 of the GPSA Engineering Data Book [1]. The corresponding Tables 1a, 2a, and 3 also show the critical temperature, number of data points, temperature range, the fitted parameters a and b for Eq. 3. In addition, for each compound the error analysis in terms of absolute percent deviation, APD (Eq. 5), the average absolute percent deviation, AAPD (Eq. 6) are reported.
For compounds listed in Figures 1-2 and Tables 1a and 2a, the 4 parameters for Eq. 4 are from reference [3] with no fitting done in this work. For compounds in Figure 3 and Table 3, the 4 parameters for Eq. 4 were fitted in this work. Note the 4 parameters of Eq. 4 are shown in Figures 1 through 3 only, but the two parameters of Eq. 3 fitted in this work are listed in Tables 1a, 2a, and 3 only.
Table 1b presents the accuracy of Eqs. 3 & 4 against limited n-butane experimental values [2]. Similarly, Table 2b presents the accuracy of Eqs. 3 & 4 against limited n-heptane experimental values. For all points tested in these two tables the absolute percent deviations (APD) from the experimental values are less than 3.42 % and 1.3% for Eqs. 3 and 4, respectively.
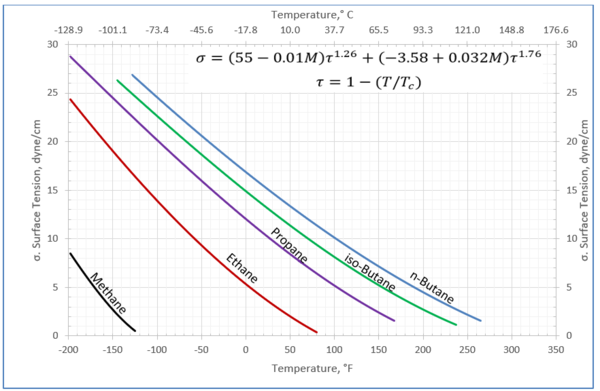
Figure 1-Variation of surface tension with temperature for methane through butane
Table 1a-The detail of surface tension modeling for the compounds in Figure 1 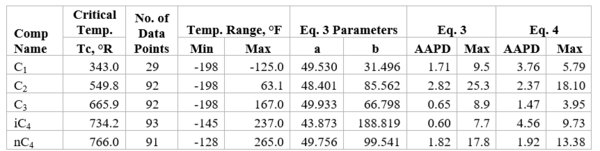
Table 1b- Accuracy of Eqs. 3 & 4 against n-butane experimental values [2]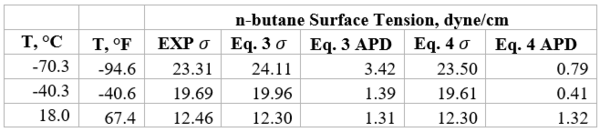
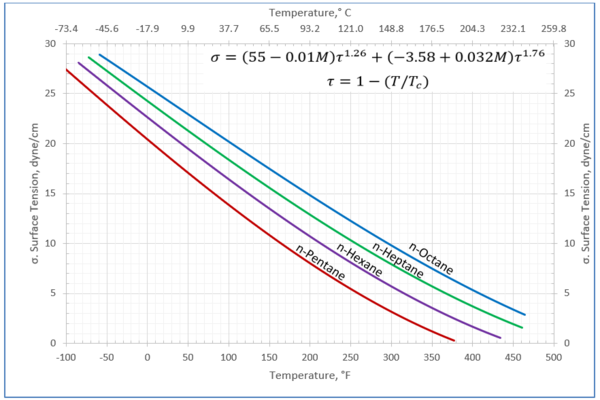 Figure 2-Variation of surface tension with temperature for n-pentane through n-octane
Table 2a-The detail of surface tension modeling for the compounds in Figure 2
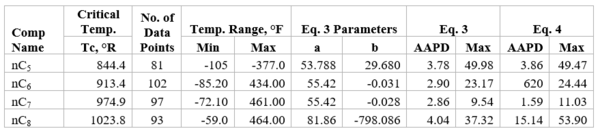
Table 2b-Accuracy of Eqs. 3 & 4 against n-heptane experimental values [2]
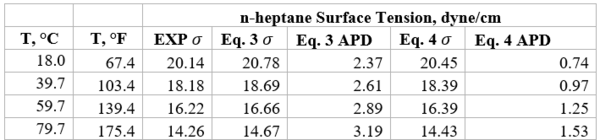
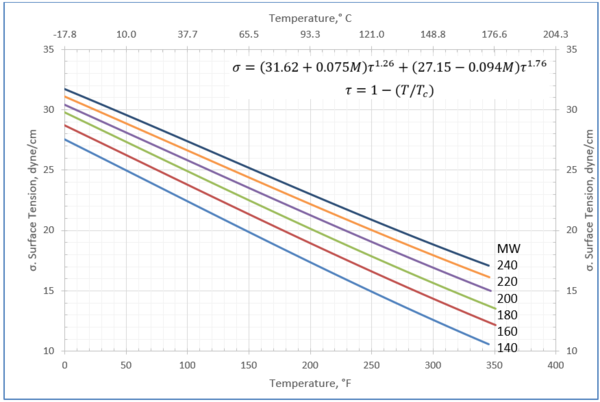
Figure 3-Variation of surface tension with temperature for heavy ends with molecular weight of 140 through 240
Table 3-The detail of surface tension modeling for the compounds in Figure 3
Corresponding-states methods:
Reference 2 discusses several corresponding-states methods for estimation of surface tension. For example, in a corresponding-states method, Zuo and Stenby [2] have used a two-reference fluid corresponding-states approach to estimate surface tensions. For reducing parameters, Zuo and Stenby used Tc and Pc according to:
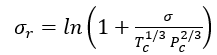 (7A)
(7A)
or 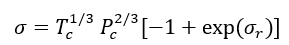 (7B)
(7B)
The units in Eqs. 7 A and B are bar (Pc), kelvin (Tc), and dyne/cm (). To use this method, for the fluid of interest is related to for the two reference fluids, methane (1) and n-octane (2) by
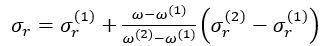 (8)
(8)
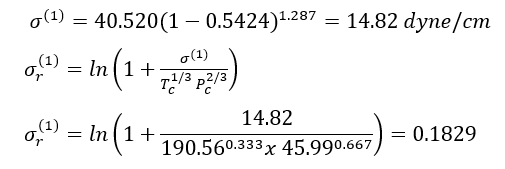
For methane (1),
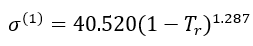 (9)
(9)
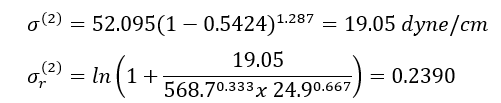
For n-octane (2),
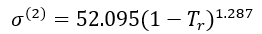 (10)
(10)
The procedure to calculate surface tensions with Eqs. 7 to 10 is illustrated in Example 1.
Example 1 - Estimate the surface tension of liquid n-heptane at 293 K. The experimental value is 20.14 dyne/cm (Jasper, 1972) in Reference [2].
Solution: - For n-heptane, Tc = 540.20 K, Pc =27.4 bar, = 0.350. Thus Tr =293/540.2= 0.5424.
For methane, Tc = 190.56 K, Pc = 45.99 bar, and = 0.011.
For n-octane, Tc = 568.70 K, Pc = 24.90 bar, and = 0.399.
With Eqs. 9 and 7A, for reference fluid 1, methane
Similarly for reference fluid 2, n-octane,
Eq. 8 may be solved for :

Finally, Eq. 7B may be solved for the desired value of for n-heptane to give:
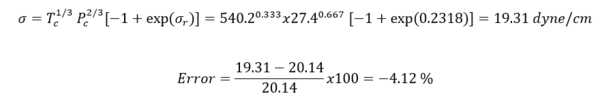
Table 4 shows the summary of surface tension results and error analysis for example 1 plus three additional temperatures. This table indicates that the results by Eqs. 3 and 4 are in better agreement with the experimental values than the Zuo and Stenby (Z-S) method of Reference [2].
Table 4. Summary of results and error analysis for example 1 plus additional temperatures
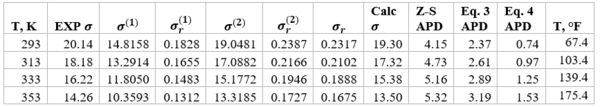
Note – Units of is dyne/cm
Summary:
The two simple equations, Eqs. 3 and 4, developed by Romero-Martinez and Trejo [3] are used to estimate pure liquids surface tensions, as a function of temperature and molecular weight for the paraffins methane through n-octane. These two Equations and the smoothed experimental data were used to generate the three Figures 1, 2, and 3 similar to the Figure 23-38 of the GPSA Engineering Data Book [1]. The summary of error analysis for these figures are presented in the corresponding Tables 1a, 2a, and 3, respectively. In addition, the corresponding states method by Zuo and Stenby of Reference [2] was used to estimate liquid n-heptane surface tension for temperatures of 293, 313, 333, and 353 K (67.4, 103.4, 139.4, and 175.4 °F). To evaluate the accuracy of Zuo and Stenby method, its estimated surface tension values were compared with the results by Eqs. 3 and 4 against the experimental values. The error analysis of Tables 1a,1b, 2a, 2b, 3, and 4 indicates that the accuracy of the charts in Figures 1 through 3 and the corresponding correlation are good for facilities calculations. Because of the simplicities and ease of calculations, Eqs. 3 and 4 are suitable for hand calculations. While the calculations by Zuo and Stenby method can be done by hand, it is more convenient with spreadsheets.
To learn more about similar cases and how to minimize operational problems, we suggest attending our G4 (Gas Conditioning and Processing), G5 (Practical Computer Simulation, and Applications in Gas Processing) courses.
References:
- GPSA Engineering Data Book, Vol. 2, 13th Ed., Gas Processors and Suppliers Associations, Tulsa, Oklahoma, 2012.
- Poling, B. E., Prausnitz, J. M., O’Connell, J.P., The properties of gases and liquids, 5th Ed., McGraw-Hill, San Francisco, California, 2001
- Romero-Martinez, A. and Trejo, A, Surface Tension of Pure Hydrocarbons, Int. J. of Thermophysics, Vol. 19, No.6, 1998.
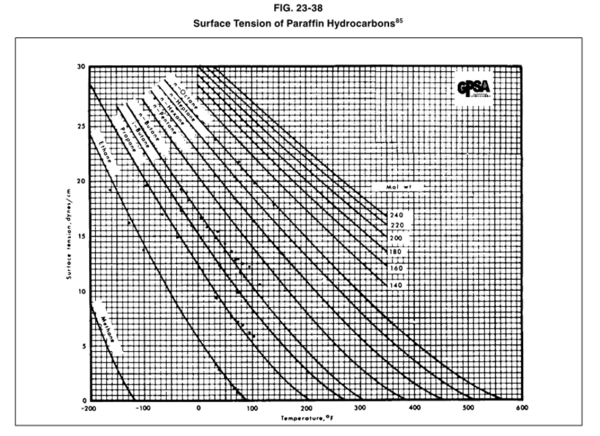
Figure 23-38 of the GPSA Engineering Data Book [1].