


Clean Energy Needs an “All of the Above” Approach to Ensure Availability and Reliability
Clean Energy Needs an “All of the Above” Approach to Ensure Availability and Reliability
Kindra Snow-McGregor, P.E.
Introduction: The big push to meet net-zero by 2050..…
In response to the Paris Climate Change Accord, many countries in the European Union have enacted climate polices intended to meet the agreements in the Accord to mitigate and reduce GHG (green house gas) emissions. The U.S. recently re-committed to join the Paris Accord after the change in the Presidential Administration in 2021.
The U.S. is currently proposing legislation on a clean energy future with the ultimate goal of decarbonizing the electric grid by 2035 [1]. The current proposed legislation defines “clean electricity generation” as any technology that has a carbon intensity of less than 0.10 tonne of CO2 per MWh. Recently, the North American Electric Reliability Corporation reported that the “the increasing importance and stress being placed on balancing resources generally fueled by natural gas to integrate large amounts of variable generation, and managing this change present one of the greatest challenges to reliability” [2]. Some recent examples of these challenges are the exceptionally high power prices California is facing coupled with frequent blackouts, and the disaster that happened during the February 2021 winter storm in Texas. Both of these examples provide insight into the limitations of solar and wind power generation. Black outs have proven to be deadly and costly in cold climate conditions. Roughly 210 people died in Texas during the February storm from hypothermia, carbon monoxide poisoning, and other related causes [3]. California recently requested the federal government to declare an “electric reliability emergency” so that the State can use more fossil fuels to avoid additional blackouts [4].
Meanwhile, Europe has been investing to decarbonize their grid at a much faster rate than has been done in the U.S. Europe has recently experienced a severe energy crunch as a result of depleted natural gas inventories and low wind speeds. On Sept. 9th, 2021, electricity prices in the UK jumped 10-fold during one seven-hour period, to a record high of ₤2,300 ($3,180) per megawatt-hour [5]. Protests have broken out in Spain where people have taken to the streets over a 40% increase in power bills from last year. The power crunch that is happening can be attributed to the large uptake in renewable energy sources, such as wind and solar, combined with an aggressive retirement of coal and nuclear power generation plants, in addition to the EU carbon tax [6].
To achieve non-fossil fuel electrical generation targets, the U.S. would need to install roughly 2.4 million MWh of clean energy generation by 2035 [7]. Not only is that a daunting (and likely unattainable) task, but one that needs to be done considering the capabilities of the technology selected. With the intermittency issues of wind and solar, there must be provisions to provide supplemental power. Currently, this is commonly done with peak shaving natural gas engine generators that can cycle on and off quickly to meet demand. Without backup power, the grid will go black during these periods of downtime. Current batteries do not have sufficient capacity to provide base-load storage, and their cost and footprint to try to do so are prohibitive.
This Tip of the Month will discuss energy issues in the U.S, and highlight why there must be an “all of the above” approach to electricity generation technologies to ensure availability and reliability. The type of technology selected should be based upon what the local resources and environment can provide as there is no silver bullet, or one size fits all solution. Energy density of the various electricity generation technologies will be covered, and some examples of current performance will be examined.
Clean Energy U.S. Tax Incentives and the “Build Back Better” Plan
Congress has continued solar investment tax credits and the production tax credits (wind) to promote the development of solar and wind power. These were scheduled to expire in 2021, but have been extended for two additional years. The solar investment tax credit (ITC) current schedule is provided in Table 1 [8].
Table 1. Solar Investment Tax Credit
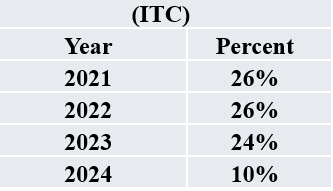
To put these numbers into perspective, a commercial 2 MWh solar array may have a total installed cost of $2.8 million dollars. The tax credit that would be received for this investment would be roughly $728 000, i.e., 26% of the total investment. These tax credits result in artificially low solar power costs as compared to other options that are not government funded.
In addition, the new bill also extended the Production Tax Credit (PTC). The credits that are provided for onshore wind turbines that were set to be reduced to 40% in 2021. These have been extended to stay at 60% for 2021, and presumably may be reduced to 40% in 2022. Offshore wind ITC is 30%, and will be available for all projects that start construction before the end of 2035. Refer to Table 2.
Table 2. Wind Production Tax Credit

These tax credits create economic drivers that promote the development of these types of installations, and disadvantages other technologies or options. In addition, the Build Back Better Act is investing billions of dollars into various “clean” technologies [9].* Assumes that next year’s PTC would be as previously planned for 2021, or 40%
- Clean Electricity - $150 billion
- Electric Vehicles - $13.5 billion
- Zero Emission Transportation - $12 billion
- Electric Transmission Wind - $9 billion
- Green Federal Buildings - $17.5 billion
- Home Electric Rebates - $27.5 billion
- Low Income Solar - $2.5 billion
The Clean Electricity bullet above is the Clean Electricity Performance Program (CEPP) that would be created at the Department of Energy (DOE) [9]. This plan compliments the tax incentives for “clean energy”. Under this program, utilities will be eligible for grant money if they increase the amount of clean electricity provided to customers by 4% compared to the previous year. The grant will pay $150/MWh for clean energy that is above 1.5 % of the previous years clean energy generation. To put the amount of the grant into perspective, Table 3 provides U.S. average energy prices as of August 2021. The grant is roughly 9% higher than the average residential electricity price.
Table 3. U.S. Average Energy Prices
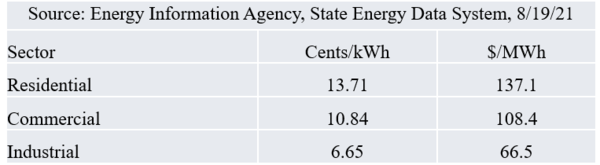
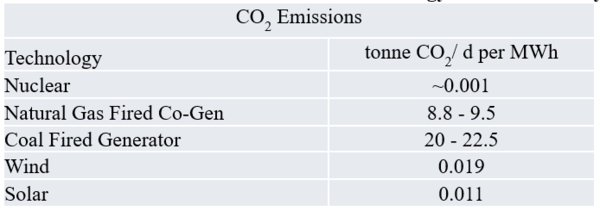
Table 4. Conventional Electrical Generation Technology Carbon Intensity [10]Utilities that fail to increase their clean energy production by 4% will owe a payment of $40/MWh for each MWh that represents the 2% shortfall. The grants are to be used to benefit their customers, including direct bill assistance, investments in clean electricity and energy efficiency, as well as worker retention. The Build Back Better plan defines “clean” electricity and any technology that has a carbon intensity of less than 0.10 tonne CO2/MWh. A comparison of current utility scale electrical generators carbon intensity is provided in Table 4.
Many folks may think that this is a good thing. However, in order to make that assessment, one needs to consider a number of other factors, including the amount of fossil fuel electric generation that would need to be replaced, the energy density of the different alternatives, and the capital costs of the various options involved.Given how the currently proposed legislation defines clean electricity, the funds are limited to only applications for building out wind, solar, possibly hydropower and geothermal. The last two options will not be focused on in this paper, as the feasibility of such installations are determined by the local resources available, so they cannot be broadly applied.
Energy Density: Why Should I care?
According to the U.S. Energy Information Administration (EIA), in 2020 the net generation of electricity from utility scale generators was 4,009 billion kilowatthours (kWh) [11]. That converts to approximately 4 million megawatthours (MWh). The breakdown of which is provided in Figure 1. It should be noted that the 20% total renewables includes solar, wind, hydro and geothermal power. The total contributed by wind (8.4%) and solar (2.3%) only sums to 10.7%.
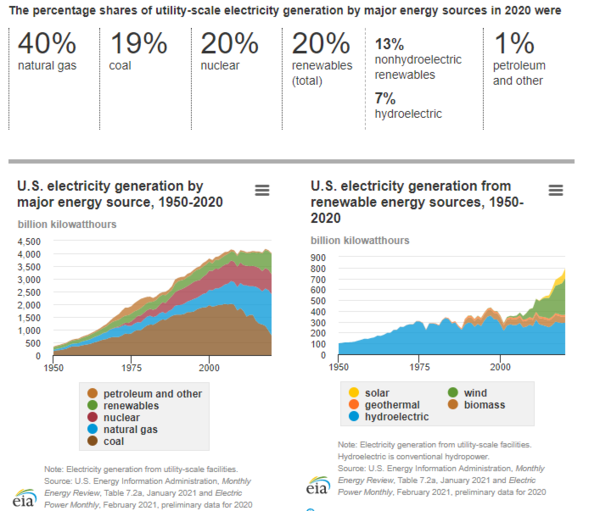
Figure 1. U.S. Utility Scale Electrical Generation by Source [11]
Roughly 60% of electrical generation was provided by fossil fuel sources (natural gas, coal, petroleum and other). This means that by 2035 we would need to build out roughly 2.4 million MWh of wind and solar generation to replace all fossil fuel sources. That’s a huge amount of power generation. The question then becomes, how does the energy density and total life cycle of the various generation technologies compare? A few comparisons using actual facilities are summarized in Table 5.
Table 5. Utility Scale Electrical Generator Technology Type Comparison – Operating Facilities*
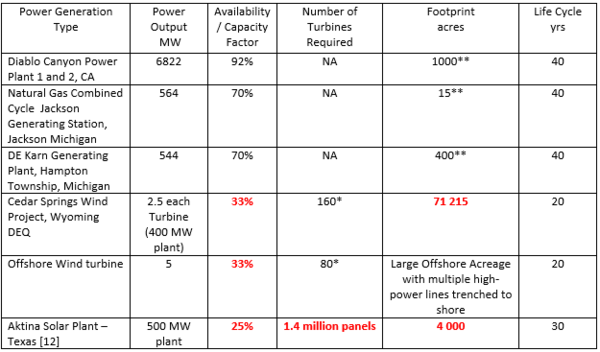
** Google Earth was used to estimate the footprint of the actual facilities quoted in the table* The data in this table came largely from EIA, and the various generators websites
Table 6 provides some higher-level comparisons so one can try to better conceptualize the differences between the actual technology applications, as they are quite significant.
Table 6. General Comparisons of the Different Technologies
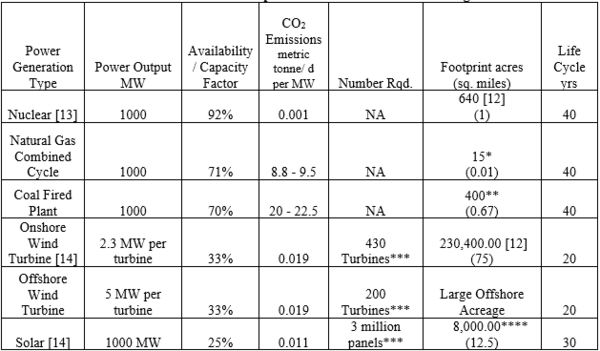
** Assumed from comparing operating fired power plants, again it is difficult to put a hard number on this as there really haven’t been any reports regarding plot plan size, etc..* Assumed for a natural gas combined cycle facility – heavly dependent upon local topography, but they have significantly smaller footprints than the other technologies
*** The number of turbines does not include the capacity factor, thus assuming a 33% capacity factor (typical for a modern wind turbine [14] the actual generation capacity may only be 333 MWh
**** Scaled up from the Aktina Power Plant
As can be seen from the comparisons in Tables 5 and 6, both wind and solar have significantly lower energy density than the other conventional energy generation technologies. Nuclear has the highest power density and capacity, followed by the natural gas combined cycle power plant, and then coal. These traditional power generation technologies have typical life cycles of at least 40 years.
The renewable technologies require significantly larger installation footprints (and in the case of solar, remove that land to be available for other productive purposes: agriculture, grazing, wildlife, recreation, etc.), and have half the life cycle of the traditional power generation options. This is a significant issue. In 20 years time, the solar panels and wind turbines will have reached their useful life and will either need to be replaced in their entirety of significantly overhauled with all new components. The other significant disadvantage is their low-capacity factors.
The capacity factor is a measure of how much energy is produced by a generator as compared with its maximum output capacity. It is measured as a percentage, usually by dividing the total energy produced during a specific time period (say 1 year) by the amount of energy the generator would have produced if it ran at full capacity during that time. Essentially, you can plan on a solar panel only producing electrical energy 25% of the time (on the high end). In the case of both Table 5 and 6, the installed solar plant production would only be 165 MWh vs the nameplate, and 333 MWh respectively. Solar only produces during daylight hours, and their electrical generation decreases on cloudy / rainy days or can be eliminated if they are covered in snow.
Wind turbines cannot produce electricity if the wind speed is too low to turn the blades, and must be shut off at very high wind speeds that can damage the turbine. In addition, they have lubrication oils that require certain minimum temperatures to work, and ice can cause damage by creating imbalance on the blades which results in a shut down. An average capacity wind turbine capacity factor of 33% is assumed for Tables 5 and 6, thus the net power output for those installations would only be 132 MWh and 333 MWh respectively. The tables also do not address the renewables intermittency production, as they will not produce electricity when the sun is not shining or when the wind is not blowing. Therefore, these energy sources require backup power generation to keep the grid from going dark. The backup power now is a mix of traditional power generators (coal and natural gas), and recently natural gas peak shaving generators (gas engines) that can cycle on and off quickly to meet variable changes in demand. The back-up power requirement will be further explored in the following section.
So, why should we care about the data presented in Tables 5 and 6? It provides insight into a technology’s requirements in terms of land use / amount of materials required to build / availability to produce energy and their typical life cycles. Now that we understand the energy density if you will of the various options, let’s take a look at the cost. The renewable energy sector has been reporting significantly reduced costs in recent years, but is that really the case? The devil is in the details.
LCOE (Levelized Cost of Energy) Analysis
The Levelized Cost of Energy (LCOE) is an economic assessment of the average total cost to build and operate a power-generating asset over its lifetime divided by the total energy output of the asset over that lifetime. One can think of this as the average minimum price at which electricity must be sold in order to break even over the lifetime of the project. However, realistically, it would be very difficult to include all of the actual costs associated with modifying a utilities energy mix. Let’s take a look at the numbers first. Table 7 provides the unsubsidized LCOE comparison from Lazard. As shown below, solar and subsidized wind look exceptionally cost competitive, if not cheaper than the alternatives.
Table 7*. Unsubsidized LCOE [15]
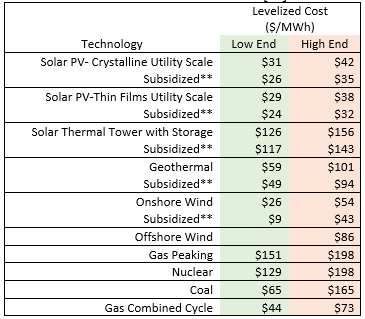
** The Investment Tax Credit (ITC) and Production Tax Credit (PTC) are included in the subsidized estimates*Factors excluded from these estimates: capacity values, network upgrades, transmission, congestion or other integration-related costs, any grid upgrades such as back-up power generation (gas peak shaving) as a result of intermittency
The Hidden Costs in this Analysis…..
The LCOE analysis does not include the solar (25%) and wind (33%) capacity factor. Thus, to produce 1 MWh including the capacity factor, one would need to install (1/0.25) times the solar panels and (1/0.33) times the number of wind turbines. There are other significant costs that are not included in this analysis:
- Changing the role of the grid’s existing coal fired power plants, or gas turbine combined cycle plants with very high availability when operating on full load from primary to backup for wind/solar have other costs that emerge due to physical realities.
- Coal power gen or GTCC (Gas Turbine Combined Cycle) plants cannot quickly be turned off and on, so capital costs increase and efficiency decreases. In addition, cycling the plants increases wear and tear as well as maintenance costs.
- Locations with a large portion of the local power supply generated from renewable energy will require flexible power generation to provide for demand when there is inadequate electricity being supplied from the renewable sources.
The US grid now has over $4 billion dollars of investment in utility scale engine drive gas generators, technology similar to those used to propel cruise ships. Most of these installations are natural gas driven, but some are fired on oil [16]. Reciprocating gas engine generators are much more flexible and have faster startup and shutdown times as compared to traditional power plant technology. For utility electricity power peaking applications, they are generally in the 20-300 MW output range [17]. These “hidden” costs are not accounted for in the LCOE energy comparisons as presented in numerous studies, again giving the false perception that renewables can replace hydrocarbons easily.
Now, let’s work an example. Let’s say the local utility wants to decommission a coal fired generator that was roughly 300 MW capacity and install 300 MW of wind. Assuming the local grid demand requires the 300 MW under high demand circumstances, and there is no additional available backup power to cover the wind turbine installation intermittency. Note you must take into account the wind turbine capacity factor to get a reliable estimate of how much power will be generated. Thus, the 300 MW wind plant could only be relied on to produce (300 MW)x(0.33) = 99 MW (or you install 3 times the number of turbines as you think you need). As a result of the wind turbine installation, 300 MW of either Gas Peaking capacity or Gas Combined cycle would be required to ensure grid stability when the wind is not blowing (to cover the coal fired generator lost production and assuming no wind conditions).
These costs are typically not included in the LCOE analysis, and as a result the installation of renewables creates a significant expense for utilities due to their intermittent production. The utility companies pass these additional costs on to their customers, which explains why the cost of electricity increases in locations where renewable energy is heavily deployed. [18]
Case Study – California
Now, let’s take a look at a few examples where the solar and wind power generation have been utilized at levels significantly greater than what is currently installed in the overall U.S. national grid. California by far has the largest installation of solar in the continental U.S. Figure 2 provides California’s Net Electricity Generation by Source, and Figure 3 provides California’s price differences from the U.S. average [19].
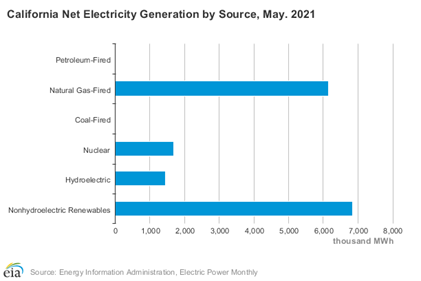
Figure 2. California’s Net Electricity Generation by Source, EIA, Electric Power Monthly [19]
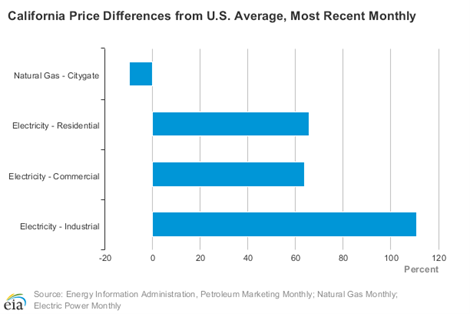
Figure 3. California’s Price Differences (% over / under) U.S. Average Prices [19]
As can be seen from Figure 2, roughly 43% of California’s energy supply is generated from nonhydroelectric renewable sources. In Figure 3, we find that California’s residential electricity prices are roughly 62% over the U.S. average, Industrial users are charged a painful 115% more than the average industrial consumer. The EIA data doesn’t break down the renewable energy sources, but according to SPOT for clean energy, in 2020 solar provided 15.7% of the states electricty generation, and wind produced 7%.[20]
Analysts note that electricity price hikes are already happening, and that is before the state’s utilities have incurred all of the costs of the deadly wildfires that swept the state, trimming millions of trees to prevent future wildfires, and adding all the mandated renewable-energy capacity, transmission lines, and new battery storage that the state will need to meet its climate goals. Further, the costs do not include all of the costs that will be incurred after the proposed shuttering of Diablo Canyon in 2025. [21]
So, what is causing the grid instability and significant power cost increases? Two primary reasons: 1. Over investment and build-out in renewable energy, and 2. Mandated retirements of gas-fired base load power plants (Encina 854 MW, Mandalay 560 MW, and Etiwanda 640 MW) [22] without thorough planning of what back-up or peak shaving generation may be required to back up the renewable build out.
As a result of the clean energy mandates from the State government, California is significantly overinvested in solar power. Solar has a “Duck Curve” in that it peaks energy production when the demand is at it’s lowest causing periods of electricity oversupply, as can be seen below in Figure 4. Electricity demand spikes after people return home in the evening, which is when solar generation decreases and stops after sunset.
In order to manage the oversupply during the afternoons, the grid operator has a choice between two decisions: 1. Sell the oversupply to another State at a loss (i.e., pay them to take the excess energy) by bidding this energy into the market, or 2. Curtail specific renewable plants to reduce output to prevent or relieve conditions that risk grid reliability. Curtailment means they are essentially dumping that energy production to zero in order to protect the reliability of the grid. Curtailments in California have been rising significantly as shown in Figure 5.
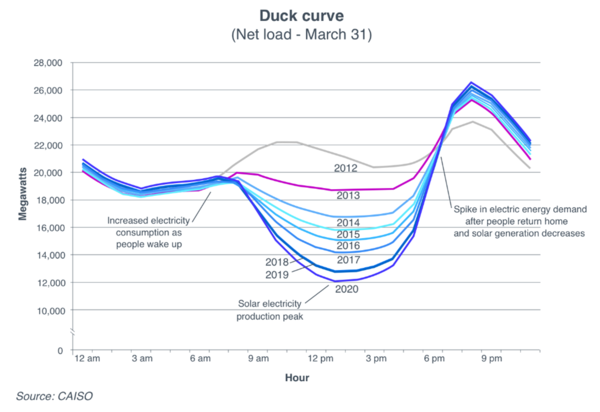
Figure 4. The CAISO Duck Curve – Solar Capacity Surplus Source: CAISO
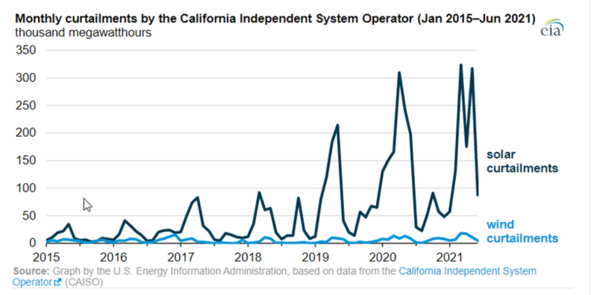
Figure 5. California Renewable Energy Curtailments
Last year, in 2020, California suffered from rolling blackouts during a heat wave where demand far exceeded the supply. The supply / demand balance for utilities with large amounts of production from intermittent producers is a significant challenge, as noted by the North American Electric Reliability Corporation. Cleary the CAISO had underestimated what the demand needs would have been in 2020. After the rolling blackouts, California’s State Water Resources Control Board voted to delay the additional retirements of four natural gas-fired power plants in response to a request by the California grid operators. The combined planned retirements made up a total of 3,750 MWh of gas-fired generation. These retirements were also planned to align with new rules requiring procurement of 3,300 MWh of non-carbon emitting electricity as part of the State’s decarbonization efforts [23].
The next year, historic drought reduced California’s hydroelectric supplies further reducing historical base-load production in combination with further retirements of gas generators to meet the mandate of a carbon neutral grid by 2045. These actions have further exacerbated the situation, resulting in soaring electricity prices and decreased reliability [21].
In June of 2021, Californians were requested to adhere to a flex alert to help the utility companies avoid rolling blackouts. During the evening hours from 5 pm to 10 pm, adjust your thermostat to 78 °F (25.5 °C) or higher (try to cool your home in the morning), don’t charge your EV until after 10 pm, limit opening your refrigerators, and keep your primary refrigerator full and unplug your secondary, avoid using major appliances such as your oven, only wash your clothes early in the morning, and charge your electronic devices before the late afternoon [24]. These types of measures must be considered when evaluating how much one of the most populated states in the U.S. is willing to change behavior to accommodate the ambitious energy plan.
In response to the grid instability, California requested the procurement of five temporary gas-fueled generators of 30 MW in August each to be installed at existing power plants with the hopes that they will be operational by September [25]. The request occurred after the Governor declared a state of emergency for the power grid on concerns about supply shortages during the hot summer evenings.
In September, California requested the federal government to declare an “electricity reliability emergency” so the State would be allowed to connect and start up the gas-fired power generating units that were ordered in August [26]. In addition, pollution limits for other gas-fired power plants would be waived to prevent them from halting their power production
California is a perfect case study of why intermittent power generation sources cannot provide reliable, dependable energy without base-load generation that can cover the short falls.
Case Study – Europe, and the U.K.
Europe and the United Kingdom. started heavy investment into renewable energy, primarily wind and some solar, years ago. This past month, they have been experiencing the same type of power crunch during an extended period of low to no-wind conditions which has taken all of the wind turbine generated power offline. The U.K. and other locations in Europe are heavily invested in both onshore and offshore wind power generation. The grid in Europe is very much interconnected between countries. For example, Ireland exports wind energy to the U.K.
On September 10th the power crunch resulted in record high energy prices in the U.K (3,180/MWh), and Ireland itself was facing supply shortages and threatening blackouts may occur [27]. Other countries in the EU, such as Spain, Germany and France were affected as well. As a result of the lack of supply, record prices for power were recorded in Spain, Portugal, Germany, and France. Protests broke out in Spain as result [28]. This energy crunch has continued since then. A recent article from Bloomberg Green describes the situation of what is happening in the U.K well in five charts, that I will show here.
Gas and electricity prices surged as a result of low winds which added to the concerns of low fossil fuel inventories. Power prices on Sept. 14 surged to $588/MWh, which is 10 times higher than the average price in September of 2020. N2EX power prices for 2021 are provided in Figure 6 below.
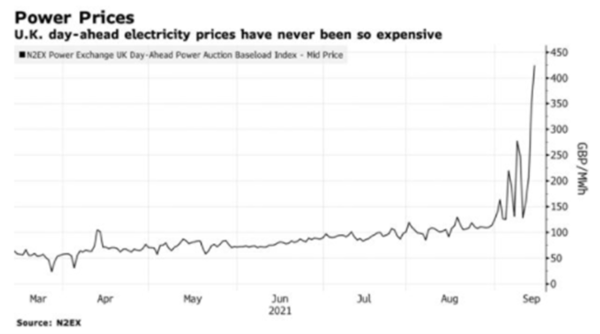
Figure 6. U.K. day-ahead electricity prices [29]
What many analysts believe is that the cost of natural gas has largely been driven by lack of supply and an increased demand [27]. As of September 10th, the cost of natural gas was at $20.18/MMBtu, and the gas supplies from Russia and Norway have been limited. In addition, they have been competing with Asia for LNG to replenish their supplies. As can be seen from Figure 7, natural gas flows from LNG terminals have been reduced to minimal levels.
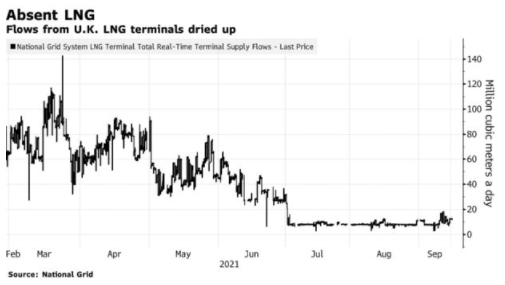
Figure 7. Flows from LNG Terminal Significantly Decreased [29]
In addition, the wind power generation cratered recently, and has been down yearly from the since 2019. This has been a significant contributor to the energy crisis that the U.K. is currently experiencing. The reduction in wind power is shown in Figure 8.
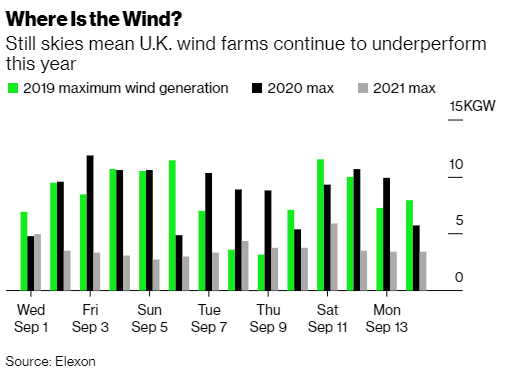
Figure 8. Wind Power Generation in the U.K[29]
An untimely compounding factor is that five of the U.K.’s eight nuclear reactors were offline, which removed 3000 MWh from the available generation. In addition, unexpected plant maintenance reduced capacity which required combined cycle gas turbine power plants to make up the difference, the further increasing the demand for gas, as shown in Figure 9.
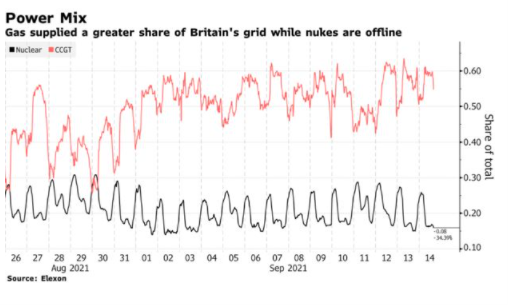
Figure 9 U.K Power supply -Nuclear and CCGT [29]
As a result of the current energy crisis, the U.K. started up three coal units within the country to bridge the gap. Typically, these plants are not operational, they are kept on standby to the National Grid to help meet the demand as required. However, the plan is to phase these facilities out completely by 2024. The current coal powered generation is shown in Figure 10.
Figure 10. U.K. Current Coal Power Generation [29]
So, what does this all mean? I will leave it to the reader to make their own assessments in terms of the root cause of the power shortages and increased power prices in California and in the U.K..
Summary
There is not a one size fits all approach to reducing a State or Nation’s carbon footprint to meet environmental goals. Serious consideration must be given to supply and demand issues, in addition to the safety and security of the local population. Baseload power generation that is replaced by renewable energy solutions needs careful consideration to ensure that adequate back-up power is available in periods of high demand and zero production from renewable energy due to weather related events. The two case studies from California and the U.K demonstrate the fallacies of assuming that intermittent electricity generation technologies can cover the demand required for industrialized nations without having the intermittency of these options planned and accounted for. These options include traditional base-load power supply from reliable sources such as nuclear, natural gas, and coal. Battery storage technology currently does not have the capacity to provide meaningly baseload storage capacities to be considered as a reliable peak shaving option at this time.
The other issues that have not been addressed in this TOTM are the climate resiliency of wind and solar. how renewable an/or disposable the components are, and why do we not have baseload battery storage for all of this excess solar and wind power that is generated.
To learn more about the global natural gas economy, we suggest attending our G2 (Overview of Gas Processing).
REFERENCES:
1. Biden’s clean energy future won’t include natural gas, World Oil, 10 Sept. 2021.
2. North American Electric Reliability Corporation, State of Reliability, 2021.
3. Texas Winter Storm Death Toll Goes Up to 210, Including 43 Deaths in Harris County, Houston PBS, Energy and Environment, 14 July 2021.
4. California wants air pollution rules suspended to burn more natural gas, World Oil, 10 Sept. 2021.
5. Europe’s ambitious net-zero pledges hit home – with eye-watering energy bills, Fortune, Energy and Gas, 10 Sept. 2021.
6. Protests Break Out in Europe as Electricity Prices Soar, OILPRICE, 10 Sept. 2021.
8. https://quickelectricity.com/federal-solar-power-tax-credit-2021/
9. Fact Sheet on EC Build Back Better Key Provisions, Committee on Energy and Commerce, Sept. 2021.
10. “Life Cycle Performance of Various Energy Sources Used in the Czech Republic, Seresova, Stefanica, Vitvarova, Zkuciova, Wolf, Koci, energies MDPI, 8 November 2020.
13. 3 Reasons Why Nuclear is Clean and Sustainable, Office of Nuclear Energy,13 March 2021.
14. https://www.nei.org/news/2015/land-needs-for-wind-solar-dwarf-nuclear-plants
15. Lazard’s Levelized Cost of Energy Analysis – Version 14.0, October 2020.
16. The New Energy Economy: An Exercise in Magical Thinking, Manhattan Institute, Report March 2019.
17. Reciprocating Engine Generator Technology, Issue 6 Vol 121, June 9, 2017.
18. Why Renewables Can’t Save the Climate, M. Shellenberger, Forbers, Sept 9, 2019.
19. California State Profile and Energy Estimates, EIA, https://www.eia.gov/state/?sid=CA#tabs-4
20. https://spotforcleanenergy.org/state/california/
21. Blackouts Loom in California as Electricity Prices are Absolutely Exploding, Bryce, Real Clear Energy,24 June 2021.
22. Natural Gas Power Plant Retirements in California, Specht, Union of Concerned Scientists, 25 Feb 2019.
23. California regulators delay natgas plant retirements, Argus Media, 2 Sept. 2020.
25. California to Build Temporary Gas Plants to Avoid Blackouts, Bloomberg Green, 19 August 2021.
26. California wats air pollution rules suspended to burn more natural gas, World Oil, 10 Sept. 2021.
27. Europe’s ambitious net-zero pledges hit home – with eye-watering energy bills, FORTUNE, 10, Sept. 2021.
29. U.K.’s Record-Breaking Energy Crunch Explained in Five Charts, Bloomberg Green, 14 September 2021.